
The Empire Strikes Back

“I felt a great disturbance in the Force.” - Obi-Wan Kenobi
I was on vacation last week, so I didn’t get a chance to write about the Bank of Japan. I did post a couple of tweets on July 28 before I left:
“This BOJ move is more aggressive than I was thinking... this seems to effectively be a 25-50 bp widening of the band (as long as the move is orderly). The BOJ was what I used to refer to as the "Last pillar" keeping longer end rates low. I think we could see more term premium returning to the longer end of the curve.... so flies in the longer end could be higher, and we could steepen AOTBE (the curve will flatten if the data/news dictate).”
We also got news last week that:
Fitch lowered the US rating from AAA to AA+. This should theoretically cause more term premium, as investors seek a higher return over time from a lower credit. However there seem to be some in the market who think this news is bullish for fixed income (based on the last time the US rating was downgraded).
The US Treasury took in less tax revenue and separately, are issuing more treasuries. I don’t follow the Treasury news that carefully, so I’m not sure what the market expectations were going in.
BOJ did a couple of interventions in the bond market. As mentioned, they will want to prevent any sudden and disorderly moves in the bond market while they are widening the band.
On net, I think the three items listed above are mostly “noise” in the short term. In my mind, the BOJ’s removal of the last pillar of global longer term rates was the KEY driver price of action the last 6 business days. The BOJ will keep the rate shift orderly, but their rate normalization is not over.
I thought I would share some “historical research” I started to do for myself. Modern QE was introduced by Japan in March 2001 (red line on chart below). Japan also introduced the world to modern Yield Curve Control in September 2016 (green line). For those of you youngins who don’t remember what things were like before the era of QE, the chart below shows the US 10 year treasury rate, the Fed’s target rate and the US 10 year real rate.
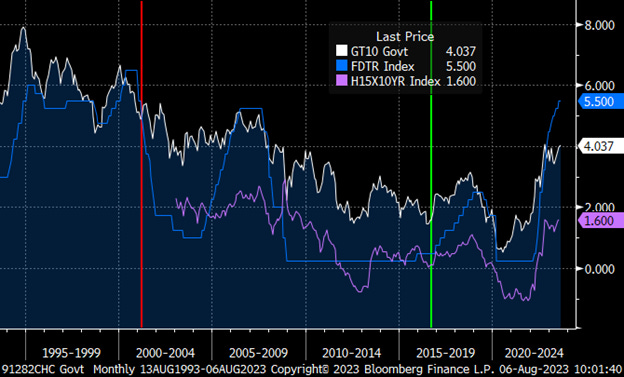
Admittedly, there weren’t a lot of things I could take away from the chart as we are comparing different time periods, environments and countries! My motivation for wanting to look at this was thinking that the current period is not too dissimilar to 1998-1999 – elevated equity valuations (mostly tech) and the Fed raising rates towards 6%. The most striking difference initially was the rate of 10s around 2000 and now. However, back then the theoretically accepted longer-term neutral rate (the Fed dots started in 2012) was probably north of 5% compared to the 2.5% now. So there isn’t a compelling reason to think tens now should be the same as back then. I do think a long term neutral rate of 2.5% (as per the Fed) is probably too low. But it’s not clear to me to what extent the productivity and demographic differences account for real rates being lower now.
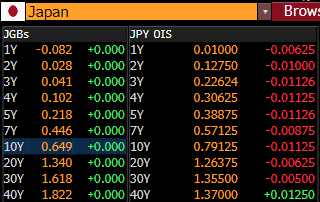
I think a view of the current Japanese yield curve tells a more interesting story. The BOJ doesn’t DIRECTLY intervene in the OIS market, but you would think the entire belly sector in all curves are kinked from interventions. Without doing any modeling, I’m eyeballing a 25bp increase in Japanese 10yr JGBs to approach a “typical” govy-OIS relationship on the existing curves. There could be a much larger move later when further brakes are released. It’s just a matter of time before Japanese tens reach the current 1% barrier, in a manner the BOJ deems orderly. When you look at real GDP projections of 1% and inflation of 1.5%, the math works closer to 2+% tens, if the BOJ completely steps away.
The reason why I lean towards additional term premium being put into the markets is two-fold:
1) The BOJ has clearly shown a desire to “normalize” rates. Expanding the range to 100bps on the current curve where 10yr OIS is less than 80bps is essentially saying that the BOJ does not want to be in the business of managing rates. This makes Buffet’s purchases of Japanese brokers earlier in the year fairly prescient. I don’t think he bought Japanese brokers thinking that any restrictive form of YCC will continue to be around. Japan is the US’s largest foreign bondholder and US rates will be affected.
2) The US continues to be horrifically irresponsible with respect to its finances. While I am hopeful the continued inflation will eat away at our debt burden, we are going to need some help with fiscal discipline. I am still stupefied we spent more money on stimulus earlier this year, in the middle of an economic recovery! I suppose similar things could be said for Japan. The doomsayers have been talking about the escalating national debt for DECADES. So clearly this is not a near-term risk. After DECADES of relatively low rates, it’s going to take even more time for the markets’ low rate anchoring to break. My trigger point was some time before Social Security runs out (in 2033), but I guess at 120% debt-GDP currently, maybe it will be when interest payments start getting to 25+% in a handful of years. It’s funny I think of this as a CERTAIN (only a matter of time) “TAIL risk” (as no one cares about it now).
Note that “additional term premium” is not the same as “bearish fixed income.” If a recession materializes, clearly rates will go lower. We are also at the previous multi-year high in yield, so we could find strong resistance.
VALUE ON THE CURVE
In terms of positioning, because of the reflation risk on the curve, I have been trying to be net long flies in my book (especially in the longer end). I like being short flies near the front of the curve, so I have (more) long flies further out the curve against it. I had steepeners on in the longer end, but I look profit on most of those and am looking for a dip to get more on. I’m assuming people will look to get into some kind of flattener in the front end for CPI, so I’m going to look around CPI (before or after) for opportunities to get on more reflation trades (long further out flies or long steepeners). I still like being short (double) flies with the middle of the front fly centered around Z5 in most countries. I think eases will most likely come later than earlier and at close to 0, these structures offer great rolldown and value. You can also consider selling weighted flies (more steepeners in back leg), based on your curve view.
Let me know via a “like” on Substack or Twitter (or just an email) if you like this post. Again, if the sum of new subscribers plus likes is greater than x% I’ll write more frequently than my baseline of once a month.
Note that this is not investment advice, you can lose money, I could be a contrarian indicator, all that glitters isn't gold, haste makes waste, and any other saying that may denote the non-seriousness of this post.
Happy trading!
Hi - are the curves you refer to in the last section SOFR, EURIBOR, SONIA etc?
Appreciated, thank you!