STIR Chart of the Year

We are still in limbo-land with respect to future fiscal policy and future Fed policy. I find it funny that the #1 Trump policy that is mentioned is tariffs, but there seems to be no consensus on whether it’s “inflationary.” Even after assuming the tariffs aren’t a negotiation ploy and they actually go into effect, some analysts think it’s a tax that will spike inflation, and others say it’s a one-time level shift in prices that has little effect in the medium term and should be ignored. I suppose whether tariffs are “inflationary” depends on your time frame. The Fed seems mostly concerned with fiscal policy effects on longer-term inflation expectations. But this is just one example of the type of ambiguity that lingers over the markets. And don’t get me started on those Trump staff nominations! Normally, you would expect decent volatility on the curve when the environment and sentiment can change quickly. But the yield curve has become a dead zone.
Some of you may know what I wrote a series of articles on the CME’s web site. For some reason if you search for “Joseph Choi,” on cmegroup.com, it only leads to the first article in the series. I’m not sure what they did with the 2nd and 3rd parts, as I was told the articles were all highly-read. It was intended to be a 4 part series, but I never got around to writing the fourth part, which was “market making.” I thought it was a good idea from a big-picture perspective, but once I started the outline, I never got to a version that I was happy with.
The reason I mention market-making is that we seem to have an algo that may be keeping the curve relatively in-line. It’s pretty amazing that SFR8 sold off over 100bps in the past 3 months and this is the chart of the SFR8 12mo double fly curve (white line on chart).
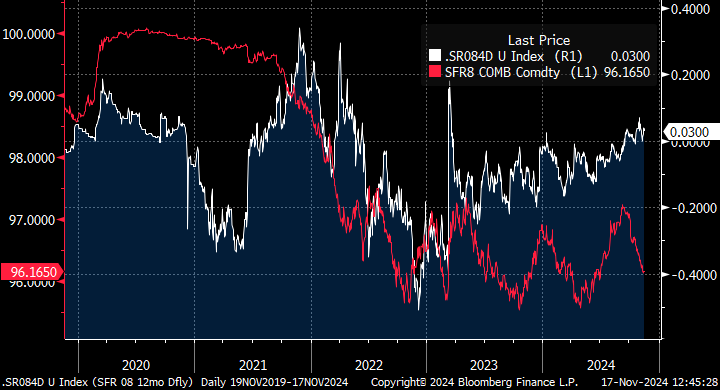
In the last 18 months, we have had a 100+bp selloff in SFR8, followed by a 100+bp rally, followed by a 100+bp selloff, followed by a 100+bp rally and followed most recently by a 100+bp selloff (see red line on the chart). In that time, the range of the year double fly has just gotten narrower and narrower (white line on the chart). This is what I meant when I said there is a noticeably larger algo presence this year than in the past. This is NOT how the double fly “should” trade with respect to major rate level changes. But this is the environment we find ourselves in.
I was going to write this week about how stagnant the longer end of the curve was. However, to my surprise, while I was presenting that exhibit on how algos are “unnaturally” keeping the longer end of the curve inline, I stumbled across what may be an even more colossally “unnatural” movement in prices. What is the deal with SFR8?